Data Profiling with WhiteRabbit
WhiteRabbit is a small application that can be used to analyse the structure and contents of a database as preparation for designing an ETL. It comes with RabbitInAHat, an application for interactive design of an ETL to the OMOP Common Data Model with the help of the the scan report generated by White Rabbit. In this phase, you’ll use WhiteRabbit to analyse the sample healthcare data and generate a scan report. This report will help you understand the data structure and quality before creating mappings in the next phase.
Download and Install WhiteRabbit
- Go to the OHDSI WhiteRabbit releases page
- Download the latest
WhiteRabbit_vX.X.X.zipfile - Extract the zip file to your desired location (e.g.,
~/WhiteRabbit_v1.0.0/)
Important: WhiteRabbit only works from paths with ASCII characters. Avoid using non-ASCII characters in your installation path.
Launch WhiteRabbit
On macOS/Linux:
cd ~/WhiteRabbit_v1.0.0
./bin/whiteRabbit
On Windows:
cd C:\WhiteRabbit_v1.0.0
bin\whiteRabbit.bat
You should see the WhiteRabbit GUI open with configuration sections.
Configure WhiteRabbit for Sample Data
Set Working Folder

Figure: WhiteRabbit Working Folder and Data Source Configuration
- In WhiteRabbit GUI, locate the “Working Folder” section
- Click “Pick Folder” button
- Navigate to the folder where you extracted the sample data files
- Select the folder and confirm
Tip: Create a dedicated folder for this tutorial (e.g., ~/carrot-tutorial/) and extract the sample data zip file there. This will create a sample-data folder with all the necessary files.
Configure Data Source Type
Since our sample data is in CSV format:
- In the “Source Data” section, select “Delimited text files” as source type
- Set delimiter to
comma(for CSV files) - Click “Test connection” to verify the configuration
Configure Scan Options
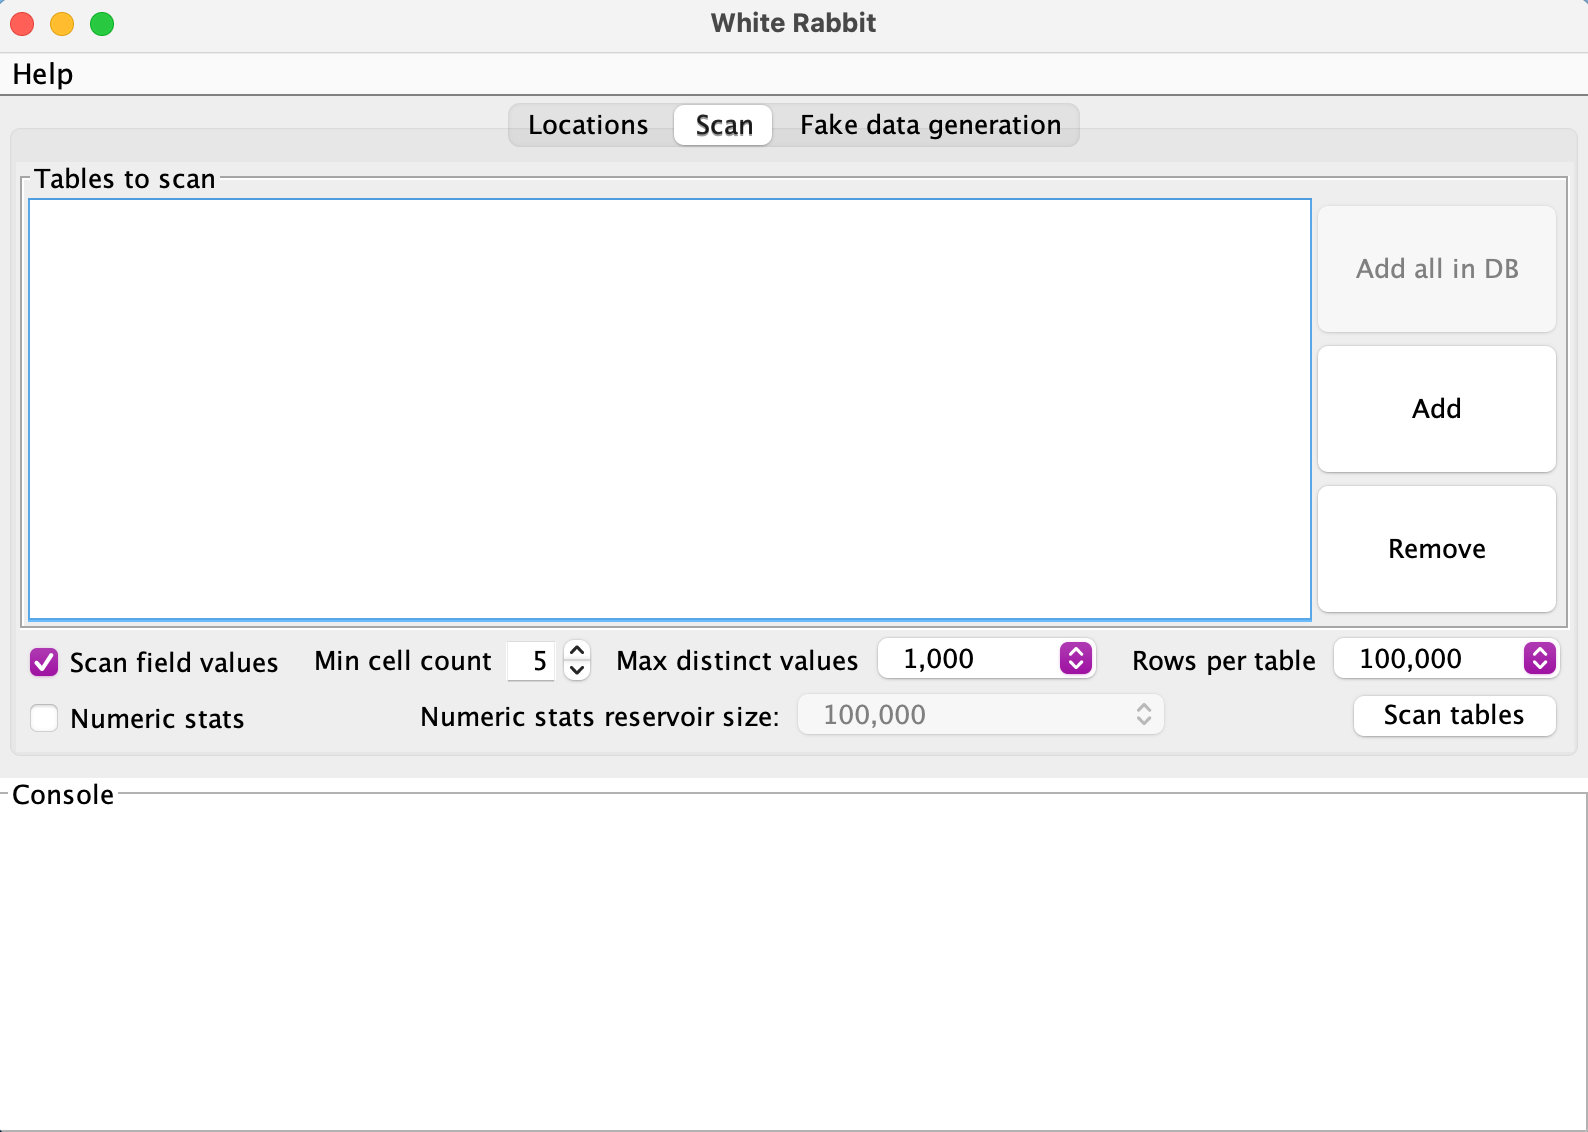
Figure: WhiteRabbit Scan Options Configuration
Use these recommended settings for the tutorial:
- Scan field values: ✅ Check this box (essential for data analysis)
- Min cell count: Set to 5 (default - values appearing less than 5 times won’t appear in the report)
- Rows per table: Choose “All rows” (our sample data is small)
- Max distinct values: Set to 1,000 (sufficient for our data)
- Numeric stats: ✅ Check this box (useful for analysis)
Select Files to Scan
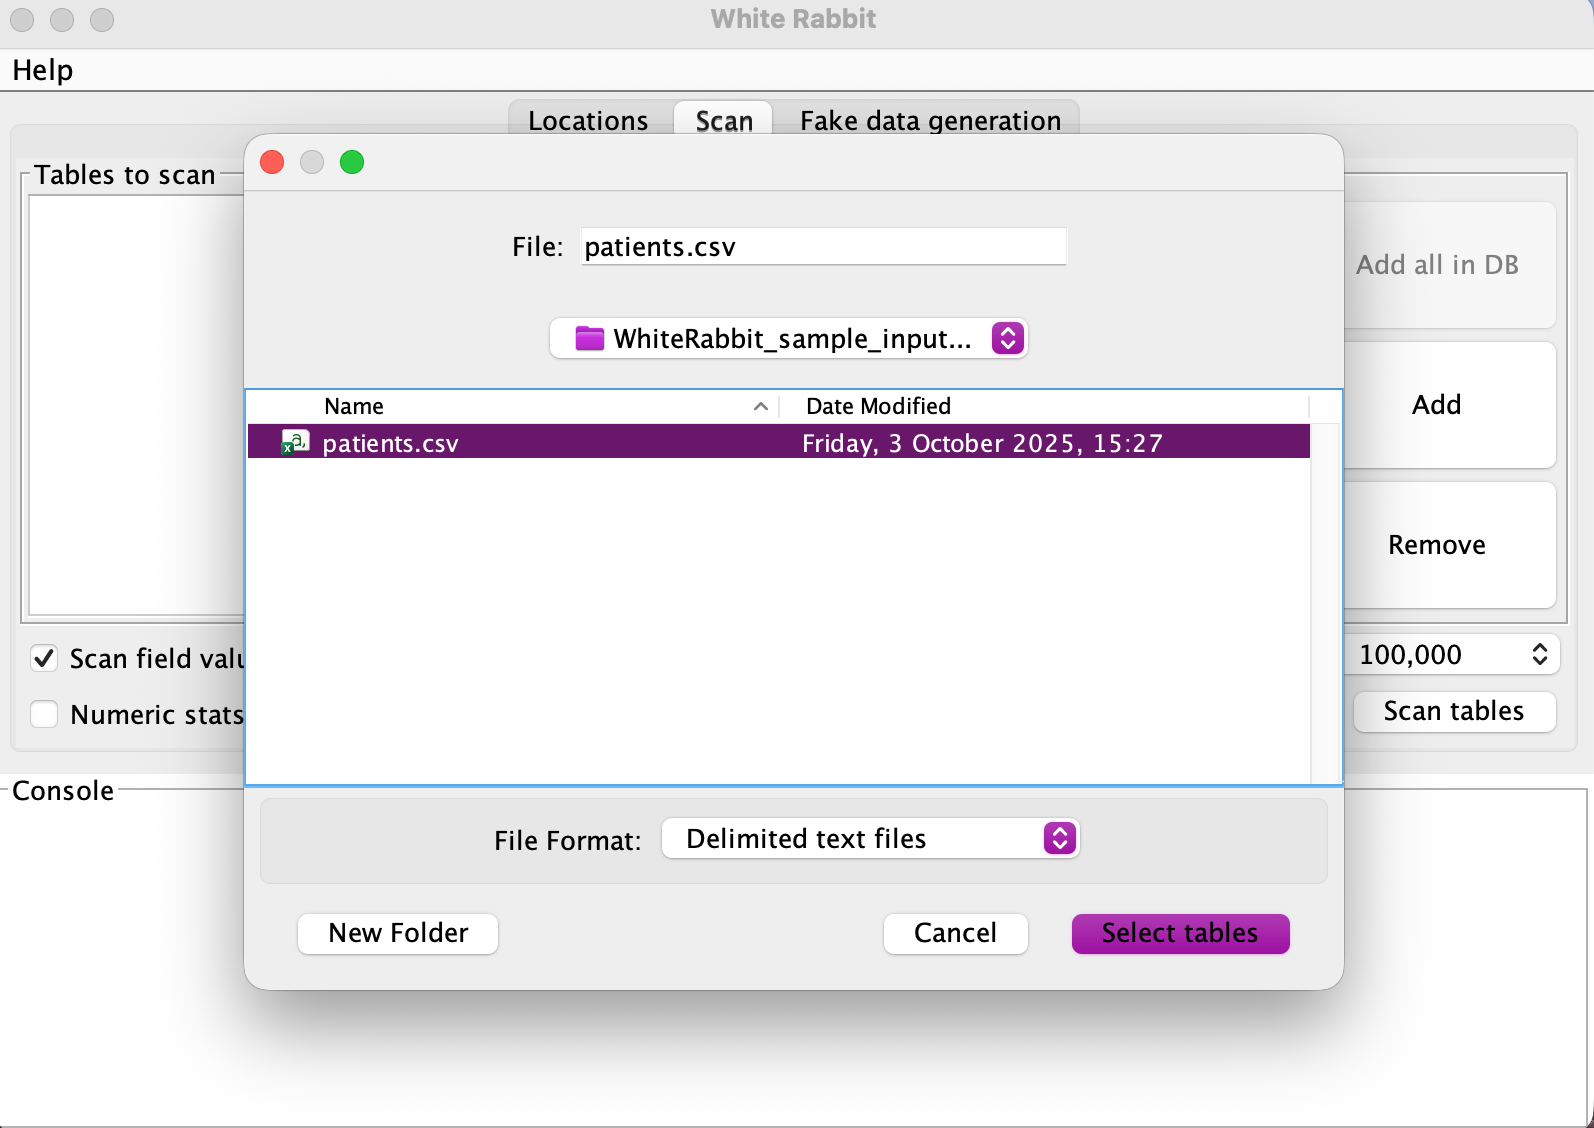
Figure: WhiteRabbit File Selection Interface
-
In the file selection area, you should see the sample data files from the
WhiteRabbit_sample_input_csvfolder:patients.csv
-
Select the CSV file for scanning
Run the Scan
- Click “Scan tables” button
- Monitor progress in the status area
- Wait for completion message
Expected Result: ScanReport.xlsx file created in your working folder
Note: The scan process may take a few minutes depending on your system performance. WhiteRabbit will analyse each file and generate detailed statistics about the data structure and content.
Open the Scan Report
- Navigate to your working folder
- Open the generated
ScanReport.xlsxfile
Examine the Report Structure
The scan report contains several tabs as described in the official WhiteRabbit documentation. Please note it is important to read the official white rabbit docs to understand the format of the data we get as output from white rabbit
Prepare for Next Phase
Let us prepare our ScanReport.xlsx before moving to the next phase.
You may copy the file to your docs folder or any other folder that will be easily accessible when we move to the carrot mapper phase.
Expected Results
After completing this phase, you should have:
- ✅ WhiteRabbit successfully installed and launched
- ✅ Sample data file scanned
- ✅
ScanReport.xlsxgenerated with comprehensive analysis - ✅ Understanding of data structure and quality
- ✅ Data dictionary ready for next phase
Next: Phase 2: Data Transformation with Carrot Mapper - Use the scan report to create data mappings